Foundational Concepts
Population, Sample, and Sample Size
A population is a defined set of individuals, and a sample is a randomly selected sub-set of a population. For example: As of 2022, Spain has 4.7M people. A sample of the Spanish population would be a random selection of 1 - to - 4.69M people in Spain.
Sample size determines the accuracy of any data calculated from a sample. This accuracy can be split into two concepts:
Confidence Level -
Certainty that our sample represents the population
Error Margin -
Certainty that our statistics reflect the population
To elaborate: We find that the average weight of all Spaniards is 70 kg with an error margin of 10% and a confidence level of 95%. The error margin means that the weight is actually somewhere between 63 and 77 kg, and the confidence level means that we are 95% sure that the average is between 63 and 77 kg.
Below is a table comparing the error margin and confidence level for different sample sizes of a population of 1 million people.
| Sample Size | Error Margin | Confidence Level |
|---|---|---|
| 31 | 15 | 90 |
| 97 | 10 | 95 |
| 664 | 5 | 99 |
| 16317 | 1 | 99 |
Statistics vs. Parameters
Statistics -
The calculated values from a sample
Parameters -
The true values from a population (Calculable if your sample is the population)
Variable Types used in Statistics (Types of data)
Qualitative (Categorical)
Ordinal -
An ordered set of variables: Always, frequently, sometimes, etc.
Nominal -
An unordered variable: Gender, Colour, Country, etc.
Quantitative
Continuous -
Numerical: Infinite values like height and weight
Discrete -
Numerical: Countable values like number of people or flowers
Three Types of Statistical Analysis
Statistics analysis is used to interpret, represent, and extrapolate data and its various trends.
1. Bias
Defines how error influences the final results.
Random Error -
 Uncontrollable error in measurement that varies randomly
 For example: A cup's length is between the smallest increment on your ruler; you round up or down
Systematic Error -
Error in measurement that skews values consistently
For example: Scale consistently measures too high by 1 kg.
2. Descriptive Statistics
Provides an idea of the differences or similarities between data by defining averages and spread.
Below is a data set of numbers for which we will calculate descriptive statistics. First are the averages, next is the spread.
-7, 1, 2, 2, 3, 4, 5, 5, 6, 22
| Type | Mean | Median | Mode |
|---|---|---|---|
| Description | Sum of all of the numbers divided by the number of numbers | Value separating the upper and lower halves | Most frequent value in a dataset |
| Example | (-7 + 1 + 2 + … + 22)/10 | Mean of 3 and 4 | Bimodal |
| Result | 4.3 | 3.5 | 2 and 5 |
| Type | Range | Standard_Deviation | Interquartile_Range |
|---|---|---|---|
| Description | Difference between the highest and lowest numbers | Amount of dispersion from the mean | Difference between the 25th (Q1) and 75th (Q3) percentiles |
| Example | 22 - (-7) | Q1 = 2 Q3 = 5 | |
| Result | 29 | 6.84 | 3 |
3. Inferential Statistics
After exploring data using descriptive statistics, the relationships between variables (eg. height vs. weight) and their consistency can be determined using inferential statistics. To understand how these relationships are tested, the null hypothesis and alternative hypothesis are defined. After which, statistical tests are performed.
Null Hypothesis
The expected idea based on current knowledge: Population 1 is equivalent to Population 2.
Alternative Hypothesis
A new idea which could nullify the null hypothesis: Population 1 is different from Population 2
Statistical Tests
Every statistical test produces:
A test statistic that indicates how closely the data match the null hypothesis

and

A P value for the probability of obtaining said result if the null hypothesis is true
Every parametric statistical test assumes:
1. Independence of observations:
   Many measurements of one test subject are not independent,
   while measurements of many different test subjects are independent

2. Homogeneity of variance:
   That variance within each group is similar

3. Normality of data:
   That quantitative data follows a normal distribution
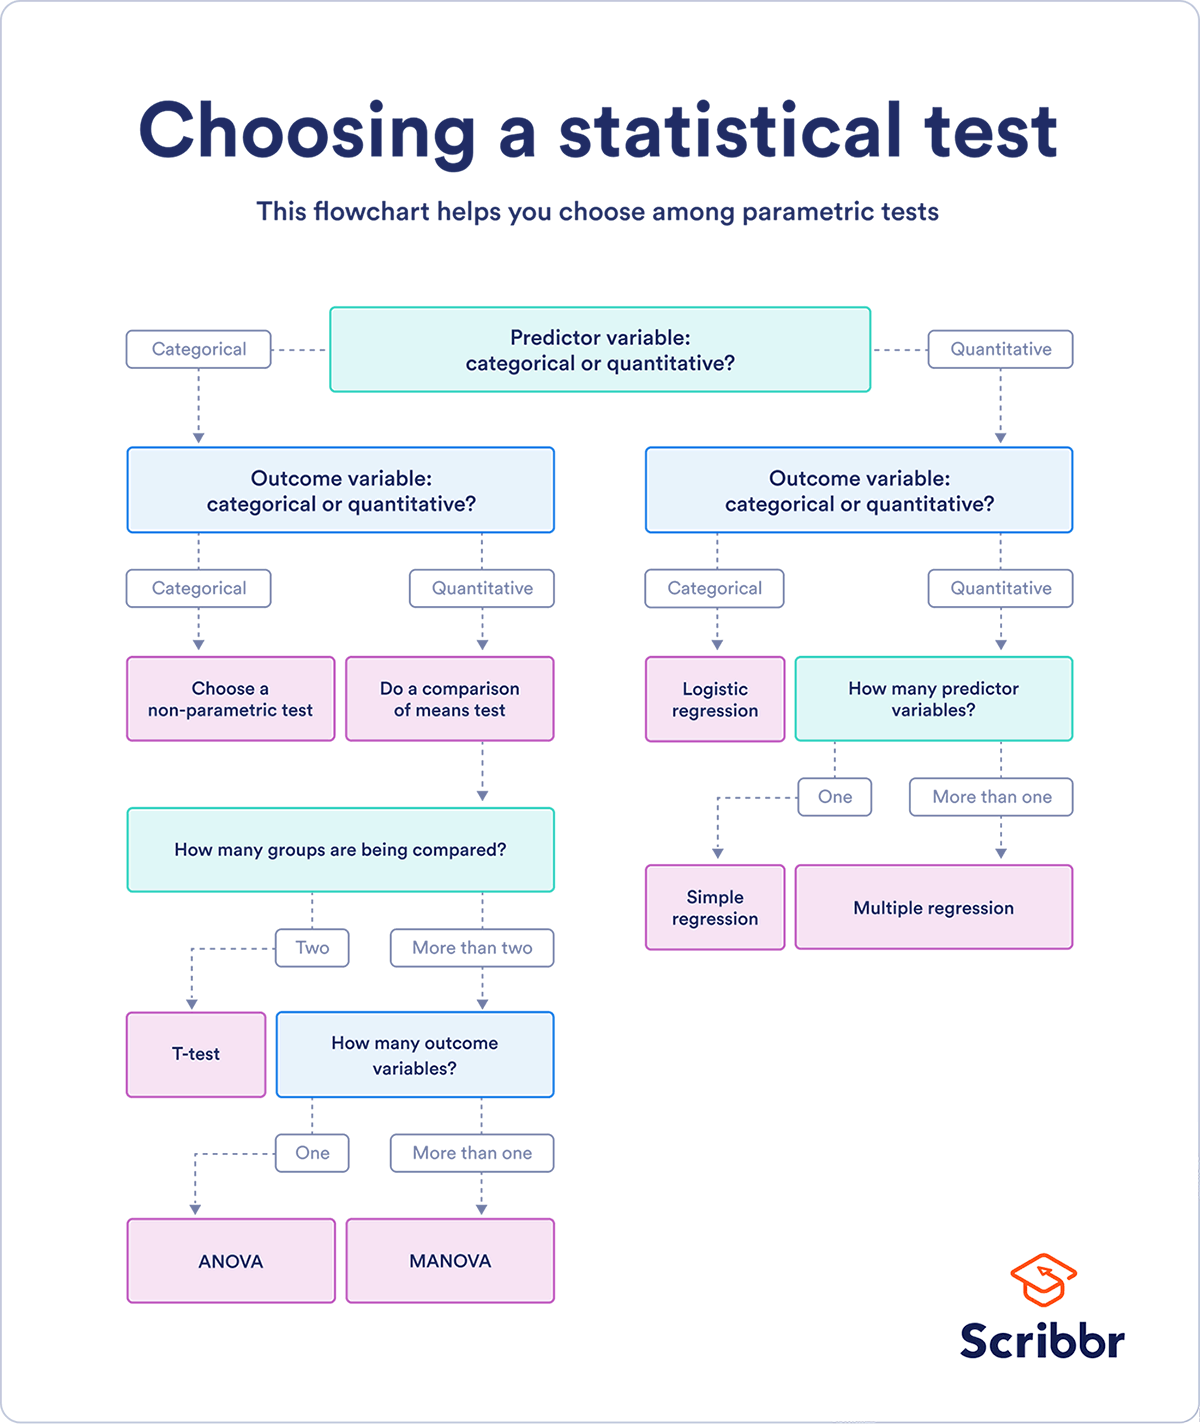
Choosing a test for parametric data can be done by following the steps in the image below. Credit to Scribbr.