GDP per capita of Spanish Regions
Data from the Instituto Nacional de Estadística and the Instituto Geográfico Nacional. Euros Inflation Adjusted to 2019
First, the 2000 and 2019 figures of GDP per capita are imported.
GDPpc_spain <- read_csv("GDP_Per_Capita_Spanish_Regions_2000_2019.csv") #Import Spanish Provinces Data
names(GDPpc_spain)[1]<-paste("provincia") # Change Province to provincia

head(GDPpc_spain, 1)
## # A tibble: 1 × 3
##   provincia `2000` `2019`
##   <chr>      <dbl>  <dbl>
## 1 Almería    15186  21196
The dataframe is cleaned for merging with one from mapSpain. This turned out being unnecessary because of the mapSpain package having many options for province names in its large dataframes.
census <- mapSpain::pobmun19

census["provincia"][census["provincia"] == "Araba/Álava"] <- "Álava" # Change alava
census["provincia"][census["provincia"] == "Balears, Illes"] <- "Islas Baleraes" # Change islas baleares
census["provincia"][census["provincia"] == "Rioja, La"] <- "La Rioja" #Change La Rioja

census["provincia"][census["provincia"] == "Alicante/Alacant"] <- "Alicante" #Change Alicante for both
GDPpc_spain["provincia"][GDPpc_spain["provincia"] == "Alicante/Alacant"] <- "Alicante"

census["provincia"][census["provincia"] == "Castellón/Castelló"] <- "Castellón" #Change Castellón for both
GDPpc_spain["provincia"][GDPpc_spain["provincia"] == "Castellón/Castelló"] <- "Castellón"

census["provincia"][census["provincia"] == "Valencia/València"] <- "Valencia" #Change Valencia for both
GDPpc_spain["provincia"][GDPpc_spain["provincia"] == "Valencia/València"] <- "Valencia"

census_gdp <- merge(census,GDPpc_spain,by="provincia")
census_gdp["provincia"][census_gdp["provincia"] == "Palmas, Las"] <- "Las Palmas" #Change Las Palmas

codelist <- mapSpain::esp_codelist # Names and codes of all provinces, autonomous territories, and cities.

census_gdp_coded <- unique(merge(census_gdp, codelist[, c("cpro", "codauto")], all.x = TRUE))
names(census_gdp_coded)[8] <- "x2000" #Change 2000 to x2000 column name
names(census_gdp_coded)[9] <- "x2019" #Change 2019 to x2019 column name

census_gdp_province <- census_gdp_coded %>%
  distinct(provincia, .keep_all = TRUE) %>% #Choose unique instance of provincia
  select("cpro", "provincia", "x2000", "x2019", "codauto") #Keep useful columns


spain_sf <- esp_get_prov() # Province borders
spain_gdp_sf <- merge(spain_sf, census_gdp_province)

Can <- esp_get_can_box() # Box in bottom left corner of map
Four plots are made from the GDPPC data.
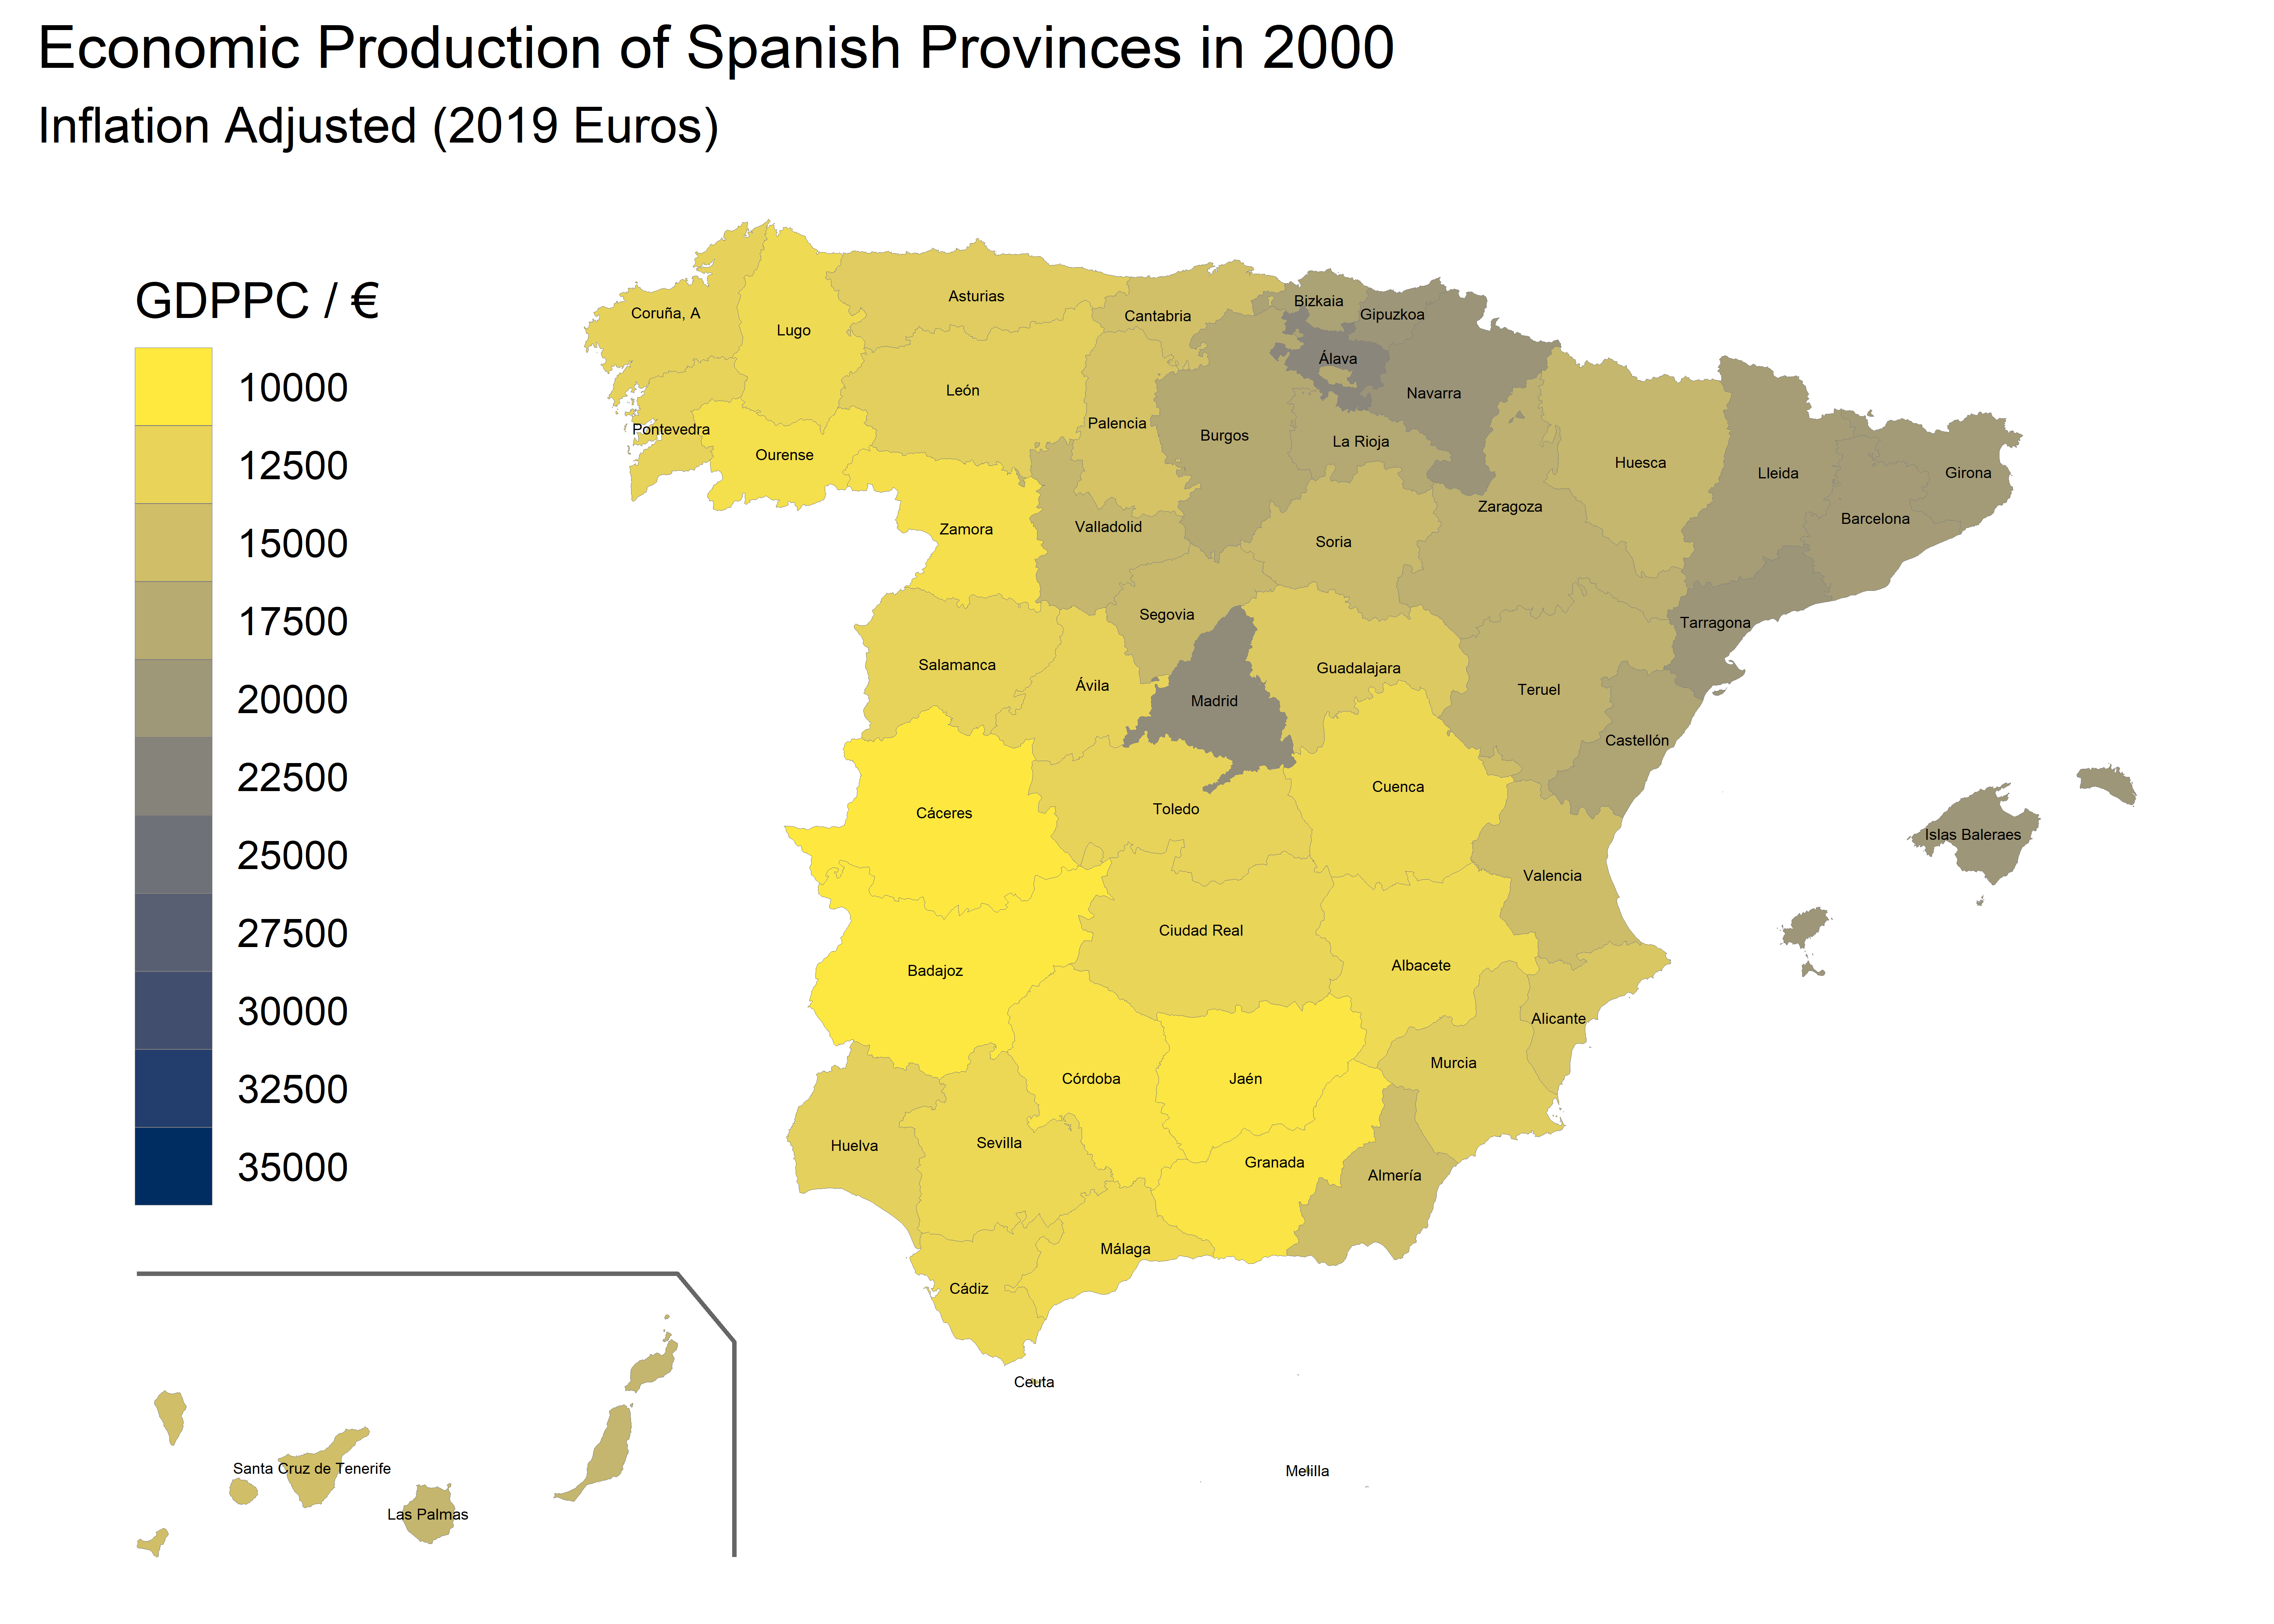
Provinces_2000 <-
  ggplot(spain_gdp_sf) +
  geom_sf(aes(fill = x2000),
    color = "grey50",
    lwd = .05
  ) +
  geom_sf(data = Can, color = "grey40") +
  geom_sf_label(aes(label = provincia),
    fill = "white", alpha = 0,
    size = 1.2,
    label.size = 0
  ) +
  scale_fill_gradientn(
    colors = hcl.colors(10, "Cividis", rev = TRUE),
    n.breaks = 10,
    limits = c(10000, 37000),
    guide = guide_legend(title = "GDPPC / €")
  ) +
  theme_void() +
  theme(legend.position = c(0.1, 0.6)) +
  ggtitle("Economic Production of Spanish Provinces in 2000", subtitle = "Inflation Adjusted (2019 Euros)")
Provinces_2000

ggsave("GDPPC_2000.png", dpi = 800)
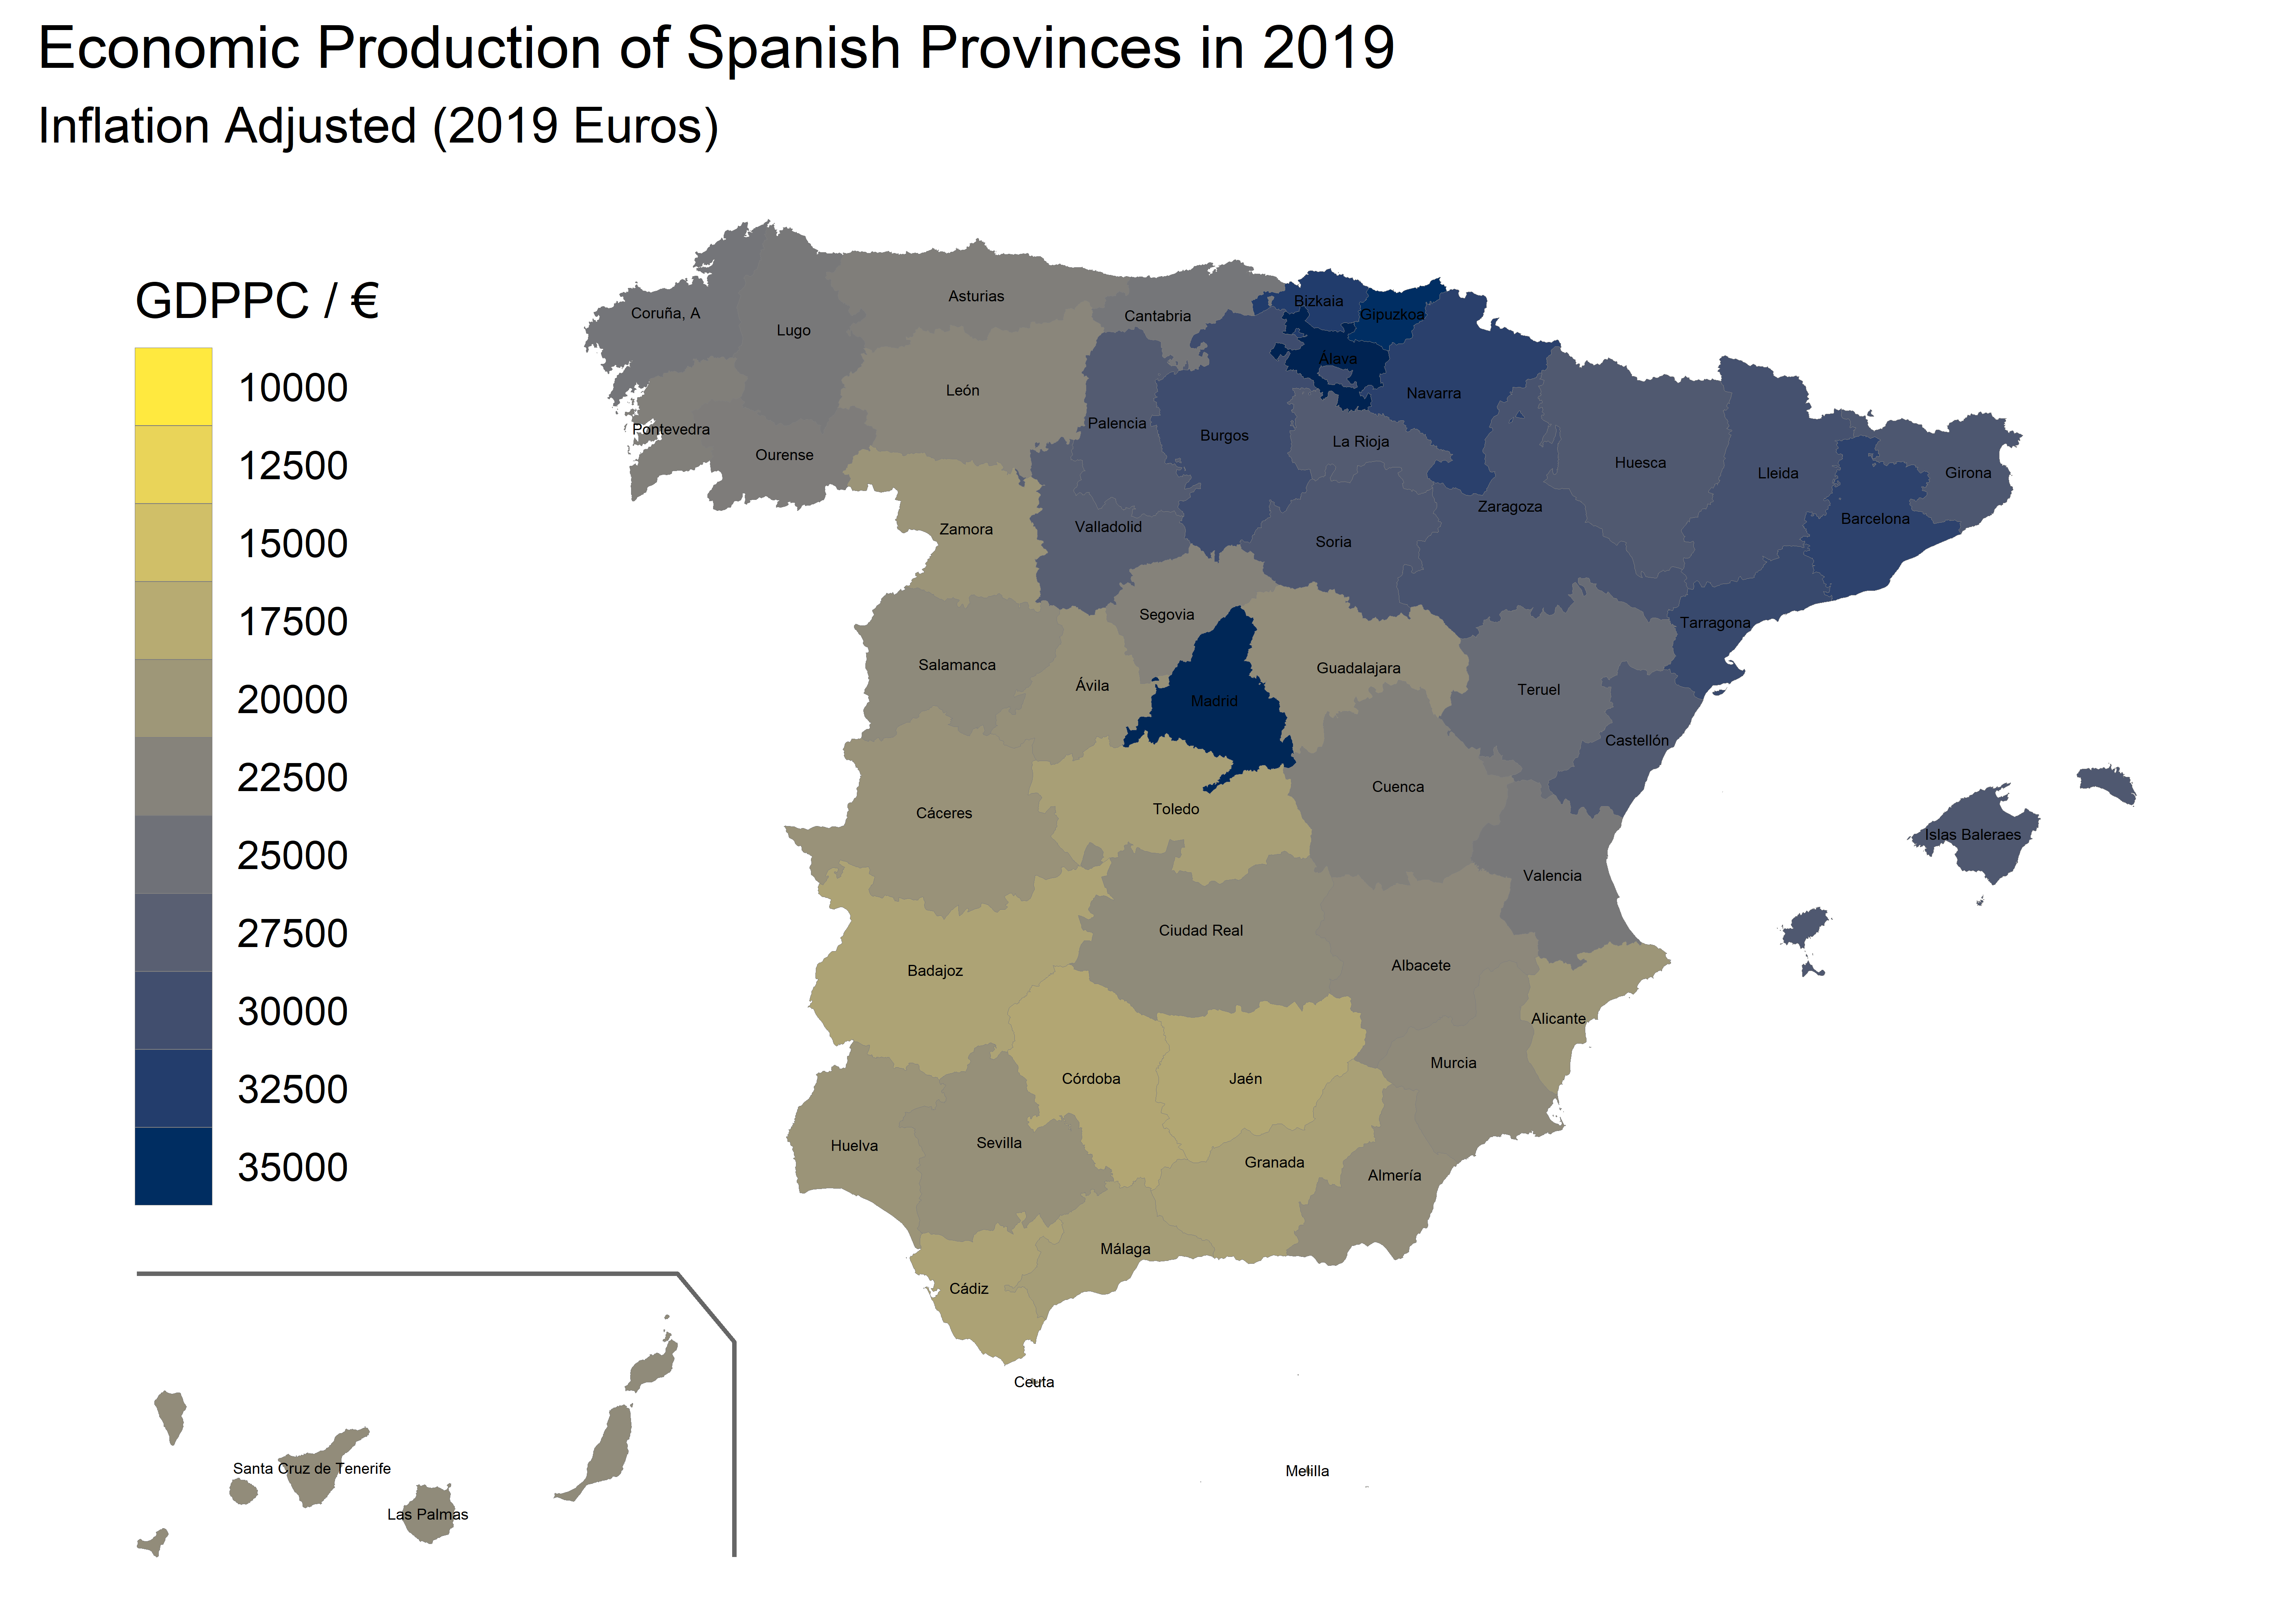
Provinces_2019 <-
  ggplot(spain_gdp_sf) +
  geom_sf(aes(fill = x2019),
    color = "grey50",
    lwd = .05
  ) +
  geom_sf(data = Can, color = "grey40") +
  geom_sf_label(aes(label = provincia),
    fill = "white", alpha = 0,
    size = 1.2,
    label.size = 0,
    colour = "black"
  ) +
  scale_fill_gradientn(
    colors = hcl.colors(10, "Cividis", rev = TRUE),
    n.breaks = 10,
    limits = c(10000, 37000),
    guide = guide_legend(title = "GDPPC / €")
  ) +
  theme_void() +
  theme(legend.position = c(0.1, 0.6)) +
  ggtitle("Economic Production of Spanish Provinces in 2019", subtitle = "Inflation Adjusted (2019 Euros)")
Provinces_2019

ggsave("GDPPC_2019.png", dpi = 800)
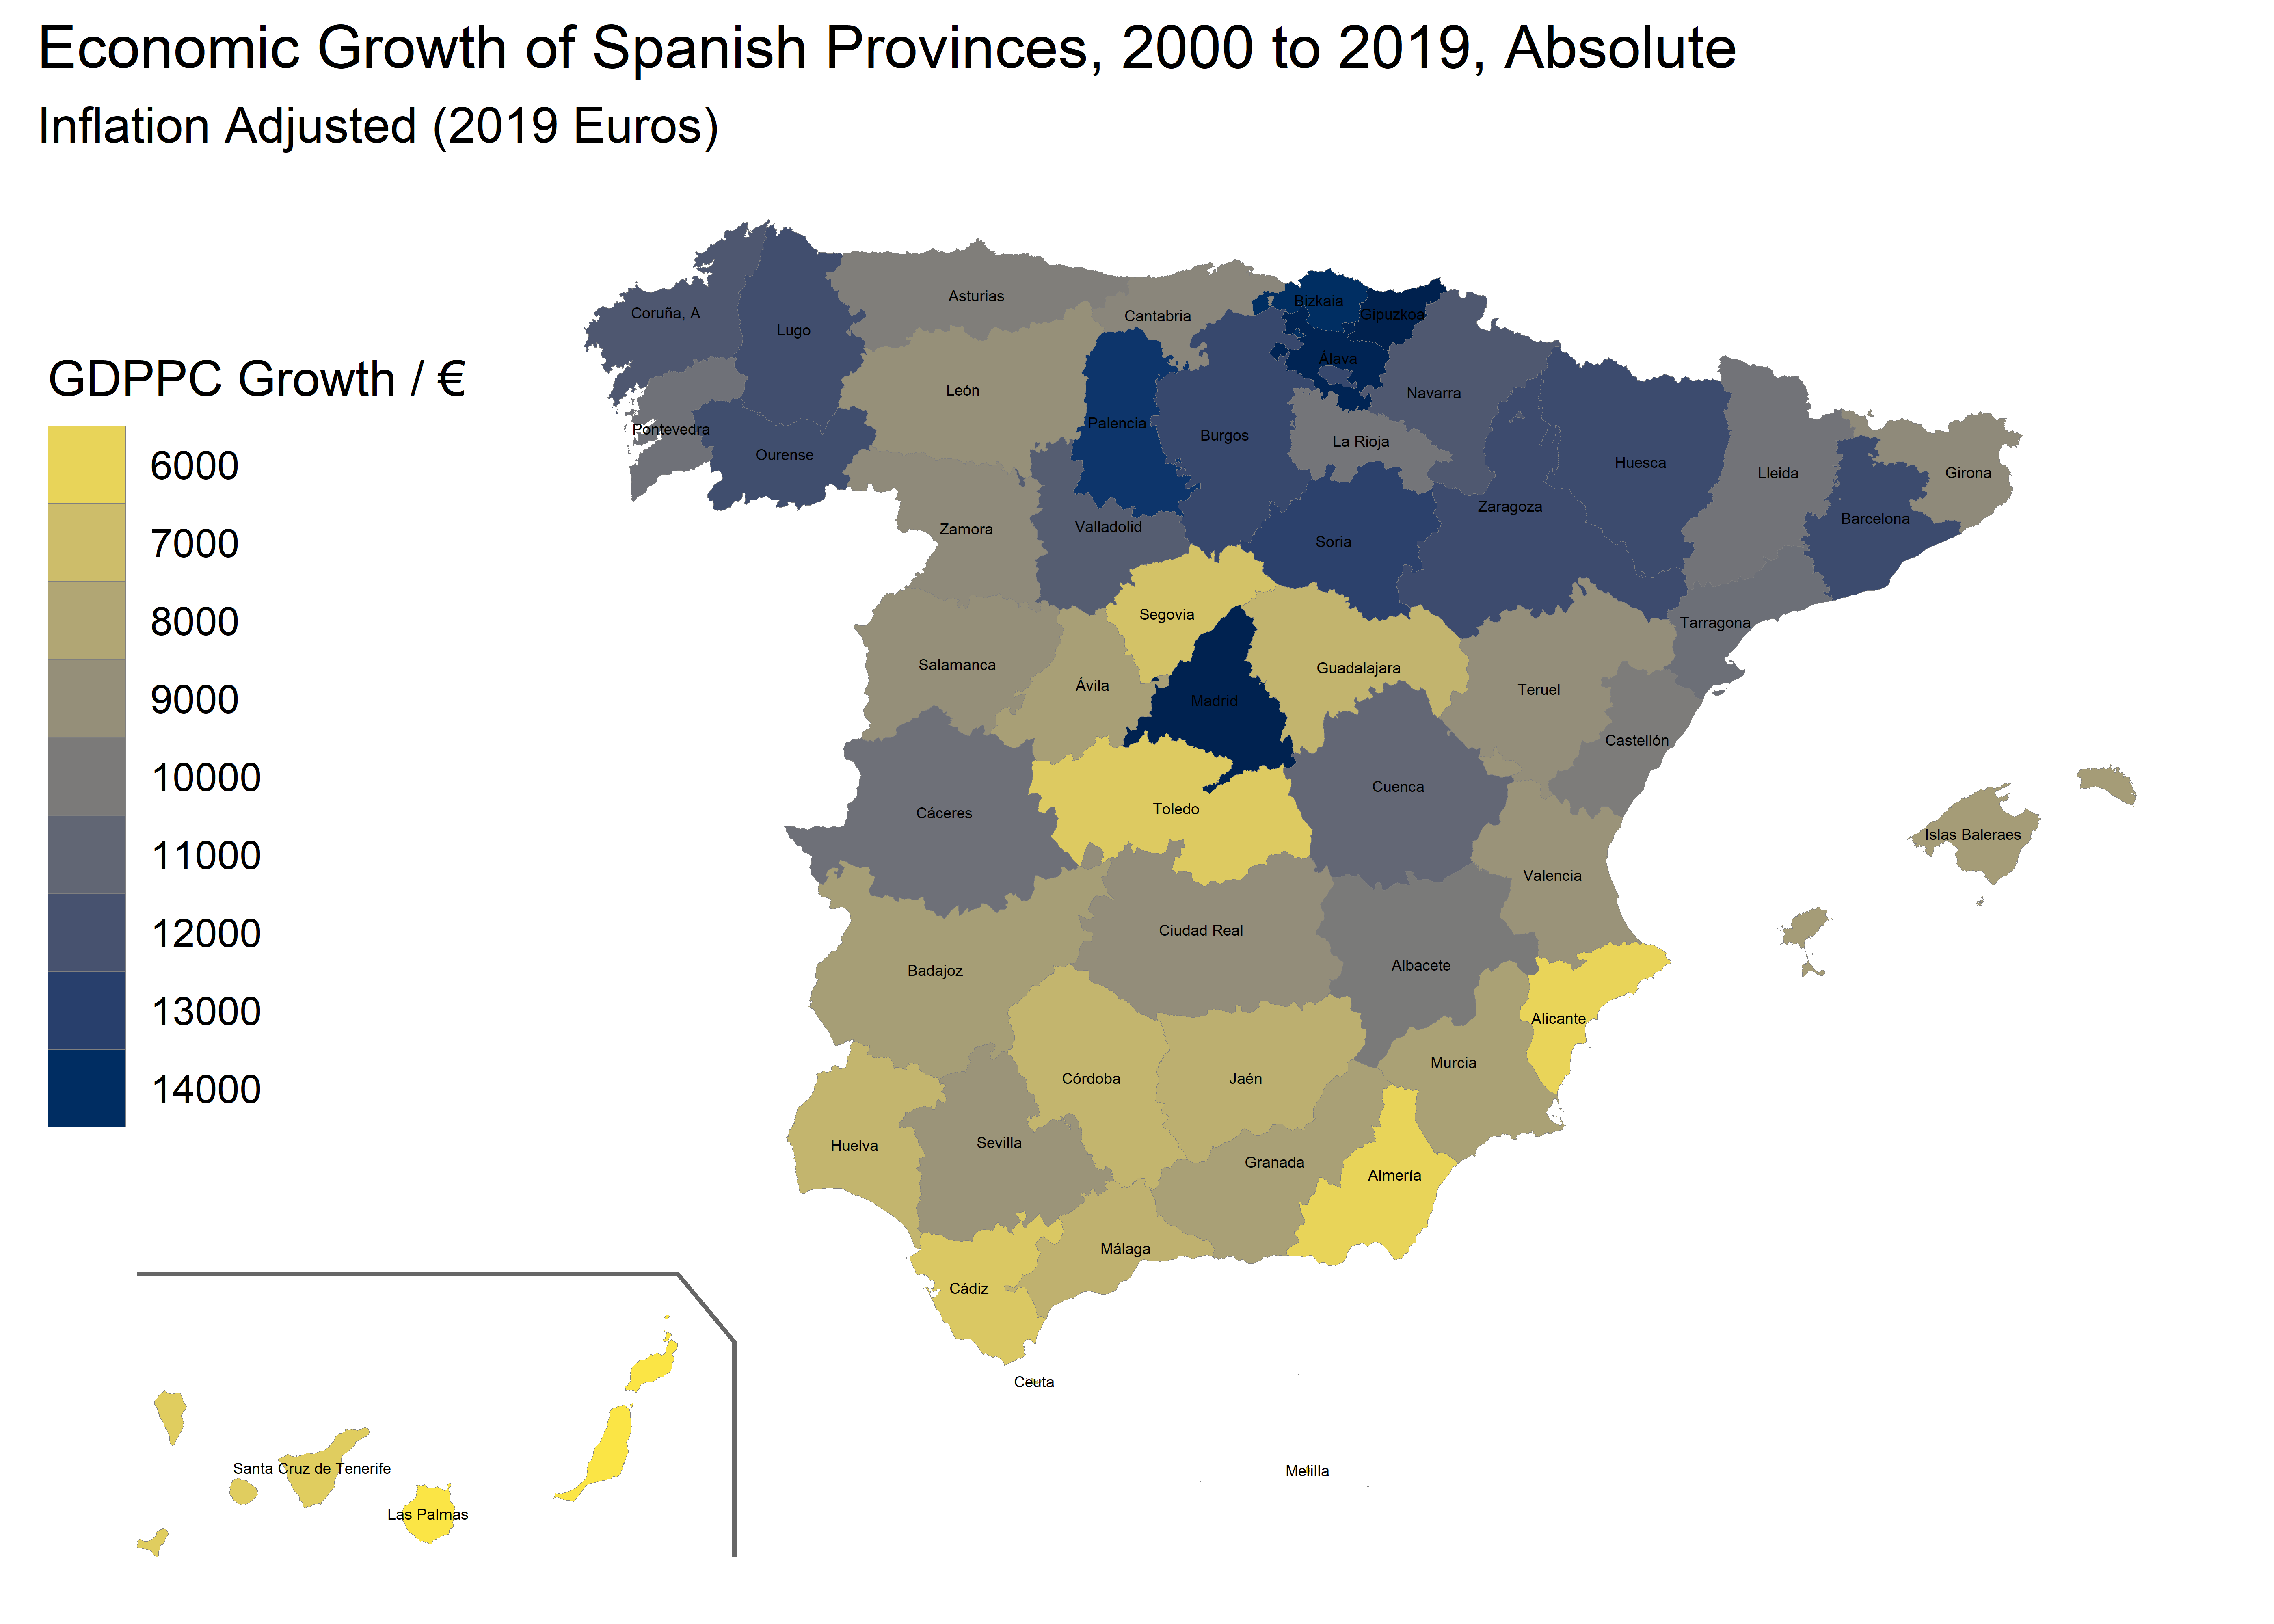
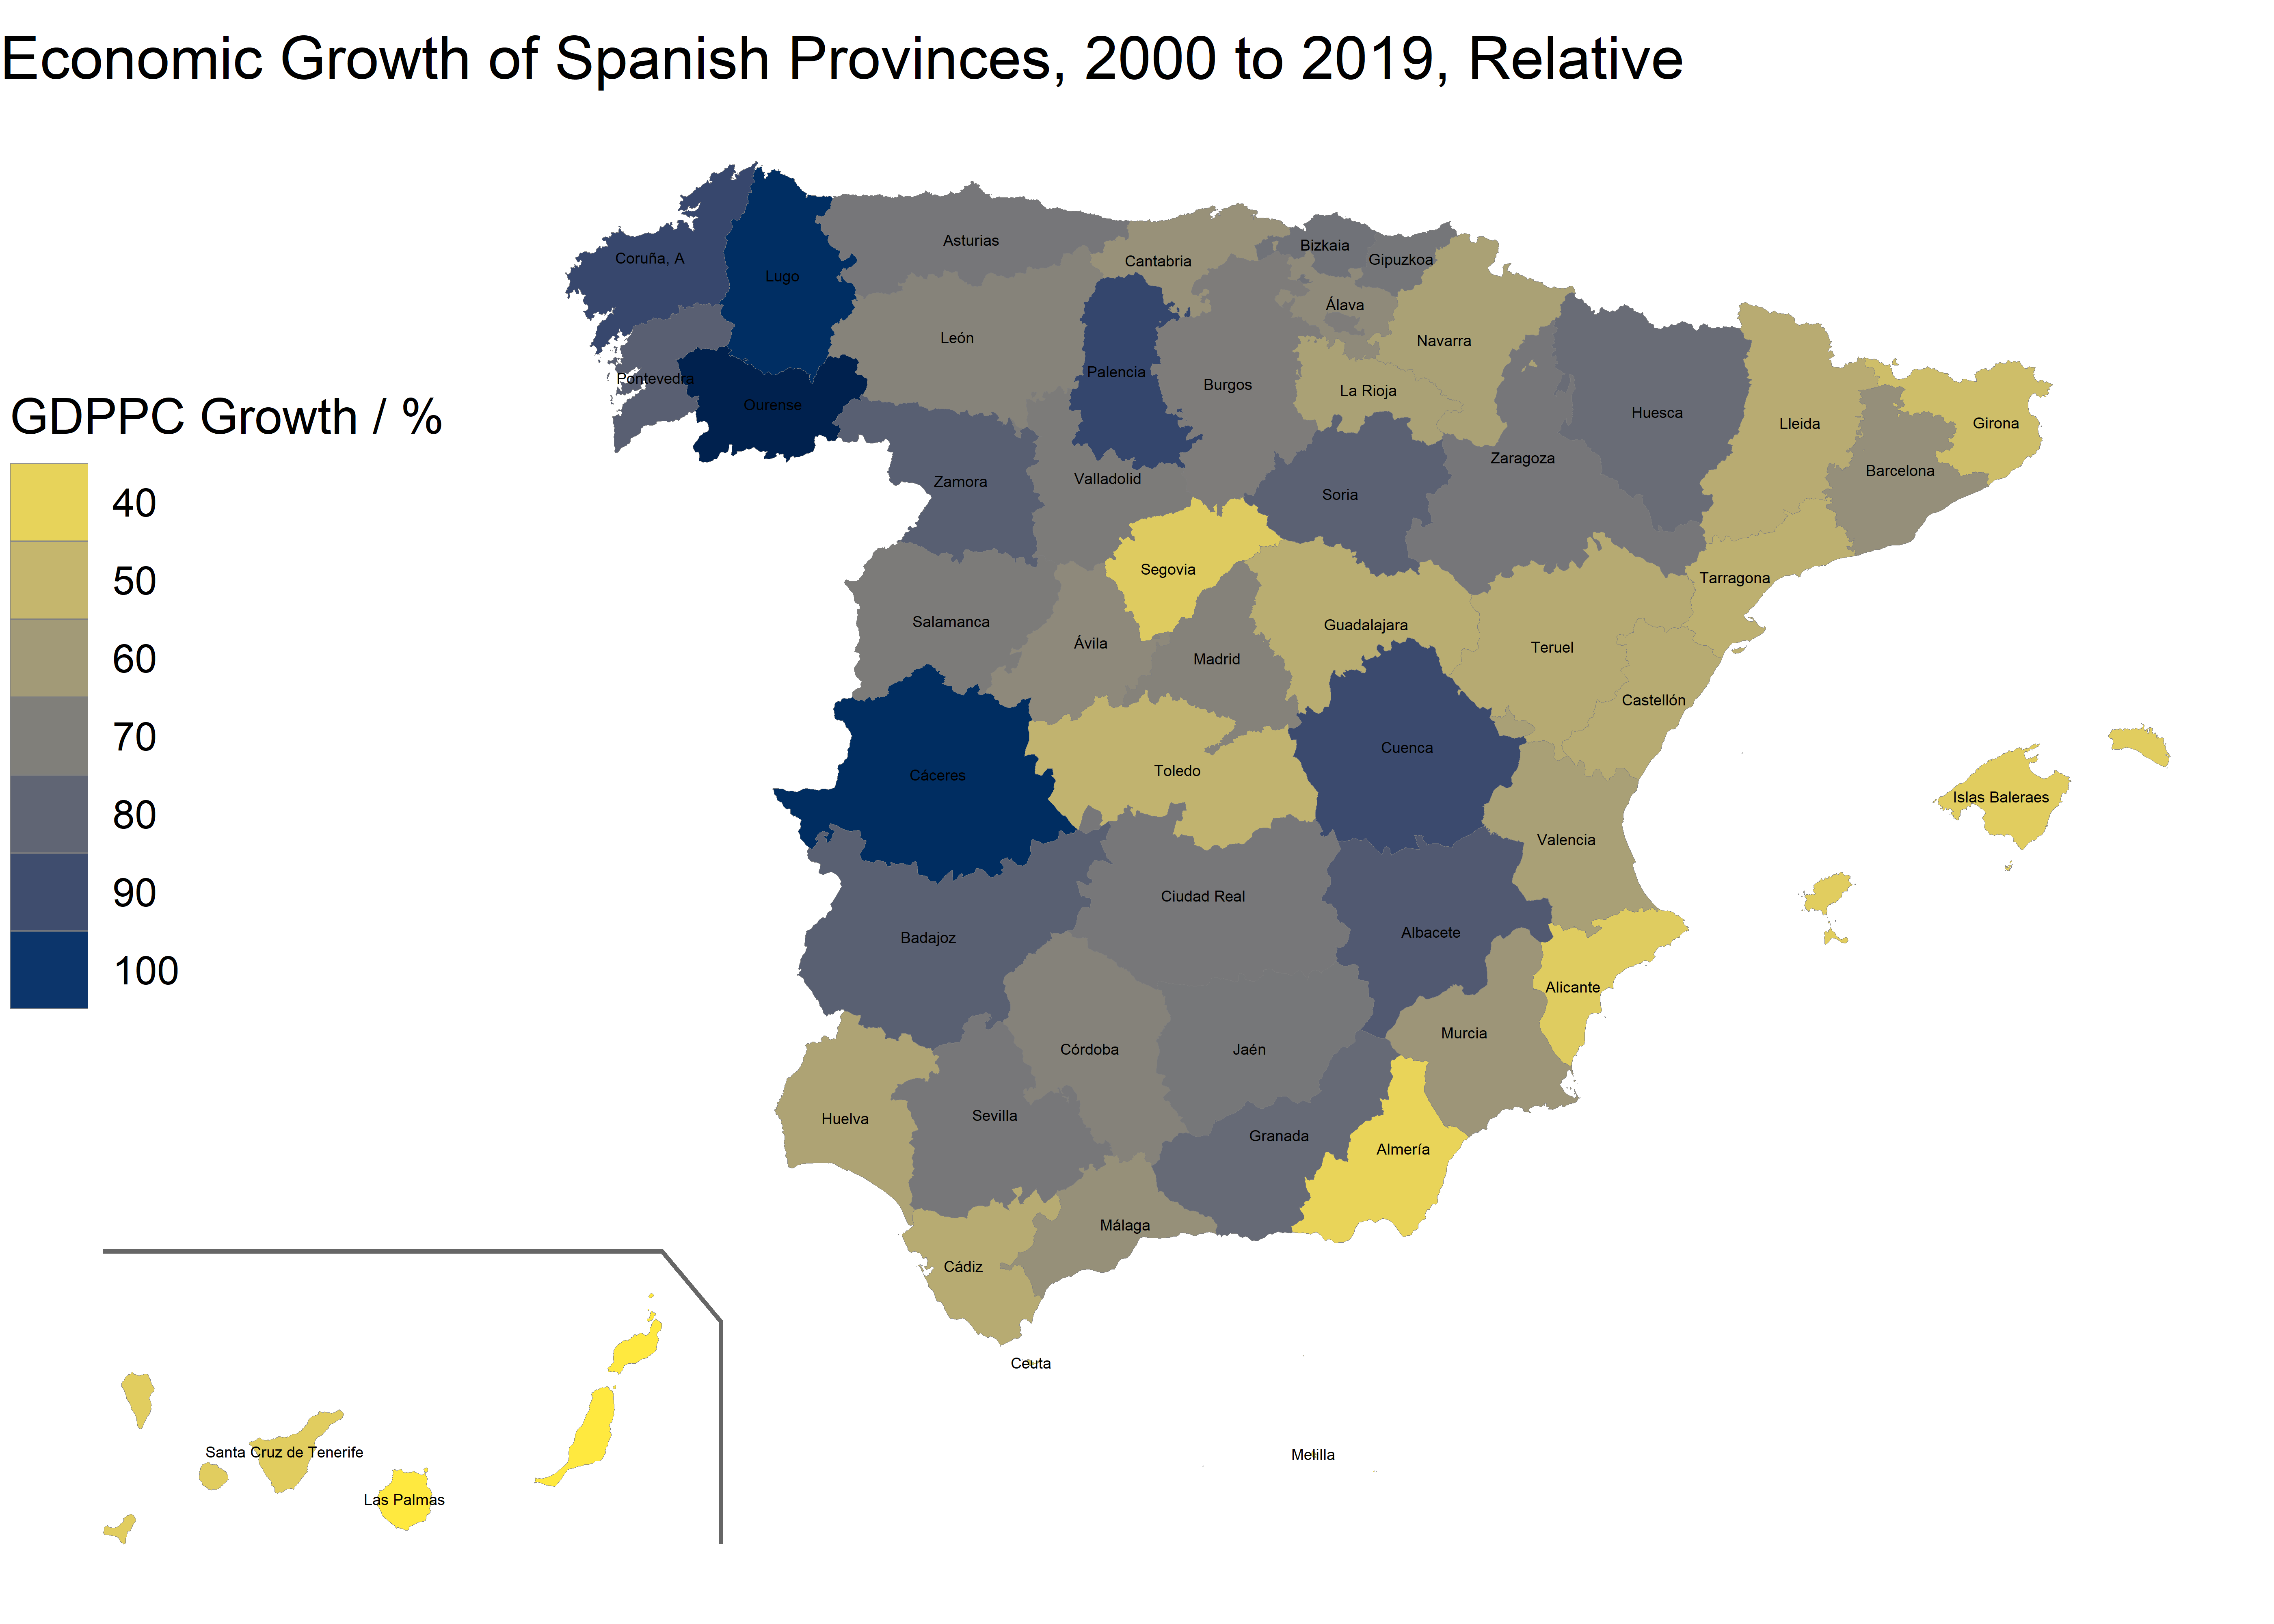
spain_gdp_sf <- spain_gdp_sf %>% #Create Absolute and Percent Columns
  mutate(Absolute = x2019-x2000,
         Percent = (x2019-x2000)/x2000*100)

Provinces_Absolute_Change <-
  ggplot(spain_gdp_sf) +
  geom_sf(aes(fill = Absolute),
    color = "grey50",
    lwd = .05
  ) +
  geom_sf(data = Can, color = "grey40") +
  geom_sf_label(aes(label = provincia),
    fill = "white", alpha = 0,
    size = 1.2,
    label.size = 0,
    colour = "black"
  ) +
  scale_fill_gradientn(
    colors = hcl.colors(10, "Cividis", rev = TRUE),
    n.breaks = 10,
    guide = guide_legend(title = "GDPPC Growth / €")
  ) +
  theme_void() +
  theme(legend.position = c(0.1, 0.6)) +
  ggtitle("Economic Growth of Spanish Provinces, 2000 to 2019, Absolute", subtitle = "Inflation Adjusted (2019 Euros)")
Provinces_Absolute_Change

ggsave("GDPPC_Absolute_Change.png", dpi = 800)
Provinces_Percent_Change <-
  ggplot(spain_gdp_sf) +
  geom_sf(aes(fill = Percent),
    color = "grey50",
    lwd = .05
  ) +
  geom_sf(data = Can, color = "grey40") +
  geom_sf_label(aes(label = provincia),
    fill = "white", alpha = 0,
    size = 1.2,
    label.size = 0,
    colour = "black"
  ) +
  scale_fill_gradientn(
    colors = hcl.colors(10, "Cividis", rev = TRUE),
    n.breaks = 10,
    guide = guide_legend(title = "GDPPC Growth / %")
  ) +
  theme_void() +
  theme(legend.position = c(0.1, 0.6)) +
  ggtitle("Economic Growth of Spanish Provinces, 2000 to 2019, Relative")
Provinces_Percent_Change

ggsave("GDPPC_Percent_Change.png", dpi = 800)
An animation is made showcasing the absolute change in GDPPC for each province from 2000 to 2019.
long_spain_gdp_sf <- # Making a "Year" column where each province has 2000 and 2019
  spain_gdp_sf %>%
  pivot_longer(
    cols = starts_with("x"),
    names_to = "year",
    names_prefix = "x",
    names_transform = list(year = as.integer),
    values_to = "GDPPC",
  )

Provinces_2000_2019 <-
  ggplot(long_spain_gdp_sf) +
  geom_sf(aes(fill = GDPPC),
    color = "grey50",
    lwd = .05
  ) +
  geom_sf(data = Can, color = "grey40") +
  geom_sf_label(aes(label = provincia),
    fill = "white", alpha = 0,
    size = 1.2,
    label.size = 0
  ) +
  scale_fill_gradientn(
    colors = hcl.colors(10, "Cividis", rev = TRUE),
    n.breaks = 10,
    limits = c(10000, 37000),
    guide = guide_legend(title = "GDPPC / €")
  ) +
  theme_void() +
  theme(legend.position = c(0.1, 0.6)) +
  ggtitle("Economic Production of Spanish Provinces Transition from 2000 to 2019", subtitle = "Inflation Adjusted (2019 Euros)") +
  transition_states(year, wrap=FALSE)

animate(
  Provinces_2000_2019,
  width = 2720, height = 1680, res=330,
  renderer = gifski_renderer()
)

anim_save("Provinces_2000_2019_Transition.gif", animation = last_animation())
![]()